

Panel by Panel: 'Meatware' and the joy of Infographics
hpkomic at March 24, 2023, 2:45 p.m.

Hello everyone, and welcome to Panel by Panel, a periodic exploration of comic panels around The Duck. This week we're going to look at the usage of infographics in comics as expositionary devices. Our panel for this comes from the comic Meatware by The Jagged. Specifically, we're looking at the most recent page, #165.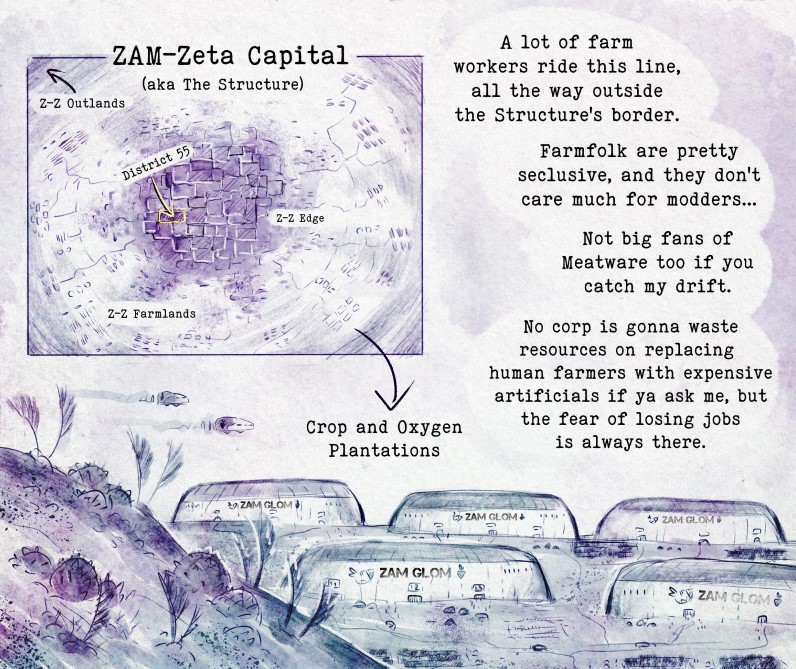
I won't be going too much into the story, but as far as this panel goes, it is placed on a page that provides a lot of context for the setting of Meatware. One of the best ways to provide context in exposition when it comes to comics is not relying on talking heads but using the medium to its strength as a visual one, such as through infographics.
Allow me to turn to Wikipedia for a moment: "Infographics (a clipped compound of "information" and "graphics") are graphic visual representations of information, data, or knowledge intended to present information quickly and clearly." We most often associate infographics with business proposals, marketing websites, and magazines. However, they encompass a whole lot more than that. They work to break down a lot of information in a way that uses visual representation. It may not initially seem like something you'd associate with comics, but they are pretty common.
For example, take a map or diagram. I am willing to bet that we've all read a comic or two that utilizes a map during expository scenes. It's a great way to establish space and location and provides often-needed context about fictional locations. Such as the case with this panel I clipped from Meatware. The scene gives us an explanation of the stratification of this society and the marginality of some groups, but it doesn't just tell us: it literally shows us.
Great stuff. We see that inset map, but we also get the complementary visual of the domes of those outside of the city to build on this theme of isolation of a population present on the page.
But how about you? Have you used infographics in your comics at all? Something beyond maps? If you want to see how good infographics can be in a comic, I'd also consider a couple of comics here: Matt Fraction's run on Hawkeye had a wonderful issue from the perspective of a dog that uses infographics to convey meaning and the dog's thought process in the story. Also, speaking of Marvel, Jonathan Hickman's recent X-Men run utilizes heavy infographics for world-building that have a very cool aesthetic.
Anyway, by all means, please share your links in the comments if you have a page that utilizes infographics.
____________
Don’t forget you can now advertise on DrunkDuck for just $2 in whichever ad spot you like! The money goes straight into running the site. Want to know more? Click this link here! Or, if you want to help us keep the lights on you can sponsor us on Patreon. Every bit helps us!
Special thanks to our patrons!!


Justnopoint - Banes - RMccool - Abt_Nihil - Gunwallace - PaulEberhardt - Emma_Clare - FunctionCreep - SinJinsoku - Smkinoshita - jerrie - Chickfighter - Andreas_Helixfinger - Tantz_Aerine - Genejoke - Davey Do - Gullas - Roma - NanoCritters - Teh Andeh - Peipei - Digital_Genesis - Hushicho - Palouka - cheeko - Paneltastic - [https://www.theduckwebcomics.com/user/L.C.Stein/]L.C.Stein - dpat57 - Bravo1102 - The Jagged - LoliGen - OrcGirl - Miss Judged - Fallopiancrusader - arborcides - ChipperChartreuse - Mogtrost - InkyMoondrop - Jgib99 - Hirokari - Orgivemedeath Ind - Mks Monsters - GregJ
Comments
Please login to comment.
Login or Register${ comment.author }} at
${ comment.author }} at